
Sources: Historical interest rates – NS&I, Finder.com
ISA Performance Comparison
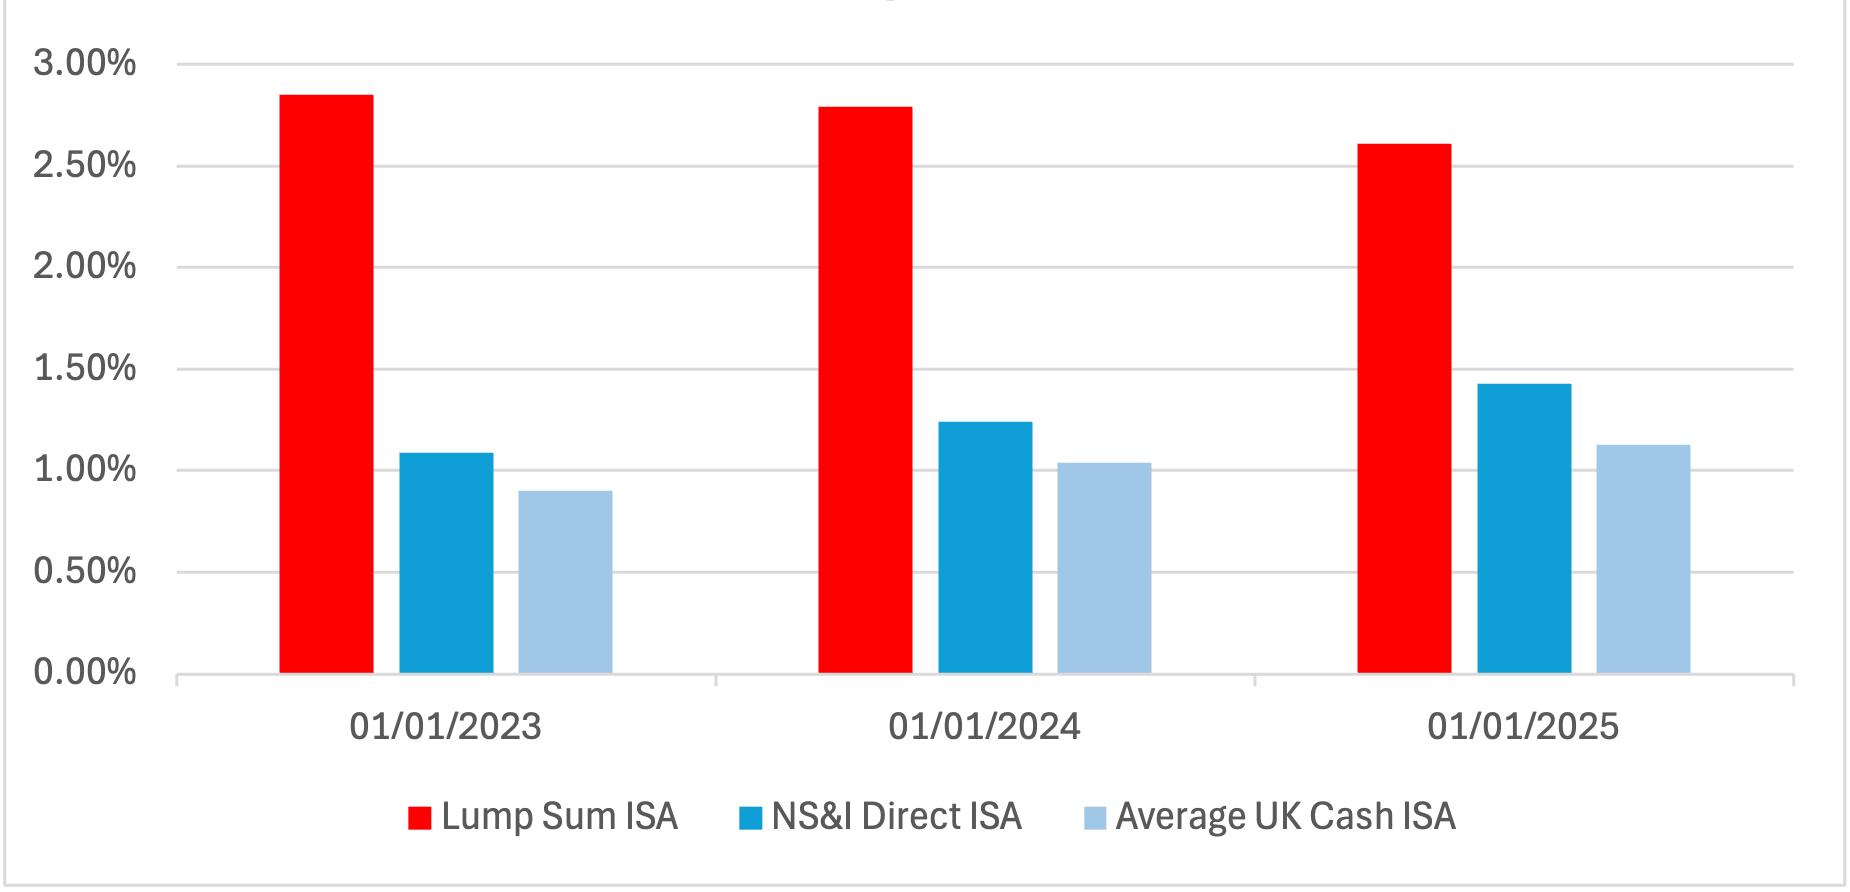
You can save up to £20,000 per tax year into our Lump Sum ISA, tax-free, with the potential of higher returns over the medium/long term than a cash ISA. The graph below shows how our Lump Sum ISA performed compared to the NS&I Direct ISA and the average UK Cash ISA.
Please note these figures relate to past performance of our With-Profits Fund and you should not rely on them as a forecast of future returns.
10 year annualised growth ISA performance comparison
Our With-Profits Fund is designed to grow Members’ money over time, and the longer your money is invested, the greater the potential for growth.
Based on past performance of the Fund, the examples below show the returns achieved as a lump sum investment or by investing regular premiums into our ISA.